
adding-numbers-single-digits
was 322
3 scores max per player; No foul language, show respect for other players, etc.
Name | Score | Date | ||
|---|---|---|---|---|
| 1 | ||||
| 2 | ||||
| 3 | ||||
| 4 | ||||
| 5 | ||||
| 6 | ||||
| 7 | ||||
| 8 | ||||
| 9 | ||||
| 10 |
Game: THE FROG FLIES
Aim: Help the frog catch the flies
Method:
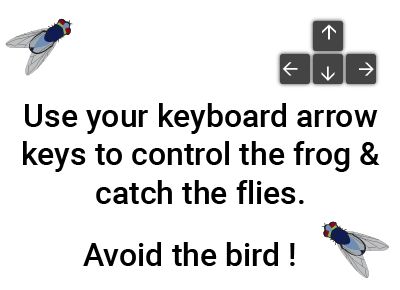
Use keyboard arrow keys or tap your tablet/mobile to control the frog and catch the flies. Avoid the birds! Answer the math questions to win additional points.
Scoring is based on speed, flies caught and the number of correct answers.


anonymous
"Which is lightest?"
THE FROG FLIES game to practice
'Grouped frequency tables' for 7th grade
7th grade / Statistics / Continuous data / Continuous grouped data / Grouped frequency tables
Grouped frequency tables
Data in frequency tables can be discrete or continuous. Discrete data consists of single values, often whole numbers, and is how most data is initially gathered. If there are many data points to process, it becomes useful to group that data into a set of classes of continuous data. Continuous data can be represented in a "Grouped frequency table". Each class covers the data points within a certain range, and the classes together cover the entire range of all the data points. In grouped frequency tables, it is important that the classes cover the entire range of the given data while not overlapping.
The benefit of grouped frequency tables becomes clear when there are so many raw data points that discrete values would become difficult to process. A limitation of continuous data is that individual data points are lost so that exact calculations of the mode, median or range of the original discrete data points becomes impossible.
In this topic you are asked to compare each grouped frequency table to the raw data that it should represent. Many of the tables have deliberate mistakes that you must identify. You can do so by counting up the data points for each class and comparing them to the given frequencies.
In the first question, the raw discrete data points are:
10, 8, 25, 18, 15, 22, 5 ,9
The grouped frequency table splits the data into classes: 1-10, 11-20, 21-30.
The frequency for the 1-10 class is given as 4. We can look through the data points and confirm that there are indeed 4 values within this range: 10, 8, 5 and 9. So that frequency is correct. Checking the 2 other classes shows us that the table does indeed accurately represent the data, so the answer in this case is "yes, the table does match the data".
With our The frog flies math game you will be practicing the topic "Grouped frequency tables" from 7th grade / Statistics / Continuous data / Continuous data. The math in this game consists of 16 questions that ask you to in each instance decide whether the grouped frequency table matches the raw data.
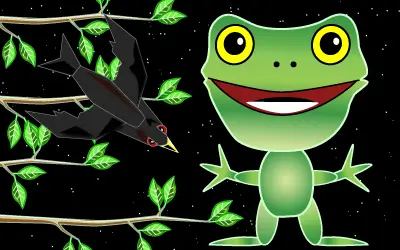
Learn or revise math with our fun interactive game THE FROG FLIES! You are a happy hungry frog in the middle of the jungle in the middle of the night. Catch the flies for your supper (and practice math just for fun).
You can play the game on tablet/mobile or desktop computer. On handheld devices you move the frog by tapping where you want it to move to. On a computer, use the arrow keys on your keyboard to move.
Sometimes a big bird swoops through the forest catching unwary amphibians so stay alert and get out of the way of its beak!
Scoring is based on flies caught, questions answered and number of deaths by bird. Your final score is your total points minus your time in seconds.
The highest scores for each topic can be saved and seen by clicking on the star button, so get learning and get your frog's name up in lights!
UXO * Duck shoot * The frog flies * Pong * Cat and mouse * The beetle and the bee
Rock fall * Four in a row * Sow grow * Choose or lose * Mix and match
Latest leaderboard entries: The frog flies


How to play THE FROG FLIES to practice
'Grouped frequency tables' for 7th grade

- Choose THE FROG FLIES from the math games page.
- On the settings page read the Method text, then click on PLAY to start the game.
- You are a small hungry frog sitting on a branch in a big jungle in the middle of the night.
- A fly is buzzing around above your head.
- Use your keyboard arrow keys or tap the screen on your tablet to move the frog and catch the fly.
- You get 10 points for each fly you catch.
- Catching a fly unlocks a question from the topic you have chosen.
- Match the question to the correct answer, or type in the answer on your keyboard.
- If you answer correctly you score an additional 50 points - a wrong answer loses you 20 points.
- Additional branches are added to the scene occasionally
- Continue to catch flies and answer questions.
- Avoid the bird that flies across the screen - it will cost you 10 points if it gets you.
- Your final score is calculated by taking your time away from the points you have scored.
- Getting one of the 10 highest scores for a topic earns you a place on the leaderboard (if you want it).
Sound effects for this game supplied by freesfx.co.uk.


